Bringing Future Cost Data to a Community Debate
Case Scenario
Recent years of hurricanes on the East and Gulf coasts have brought record amounts of rainfall and flooding to communities in Texas, Louisiana, and the Carolinas, spurring debate in other Southeastern cities about how best to prepare for future storms. A community leader is concerned about the risk of flooding in their city. With the UAA, they can find their city, and on the City Profile page, select the Flood hazard tab.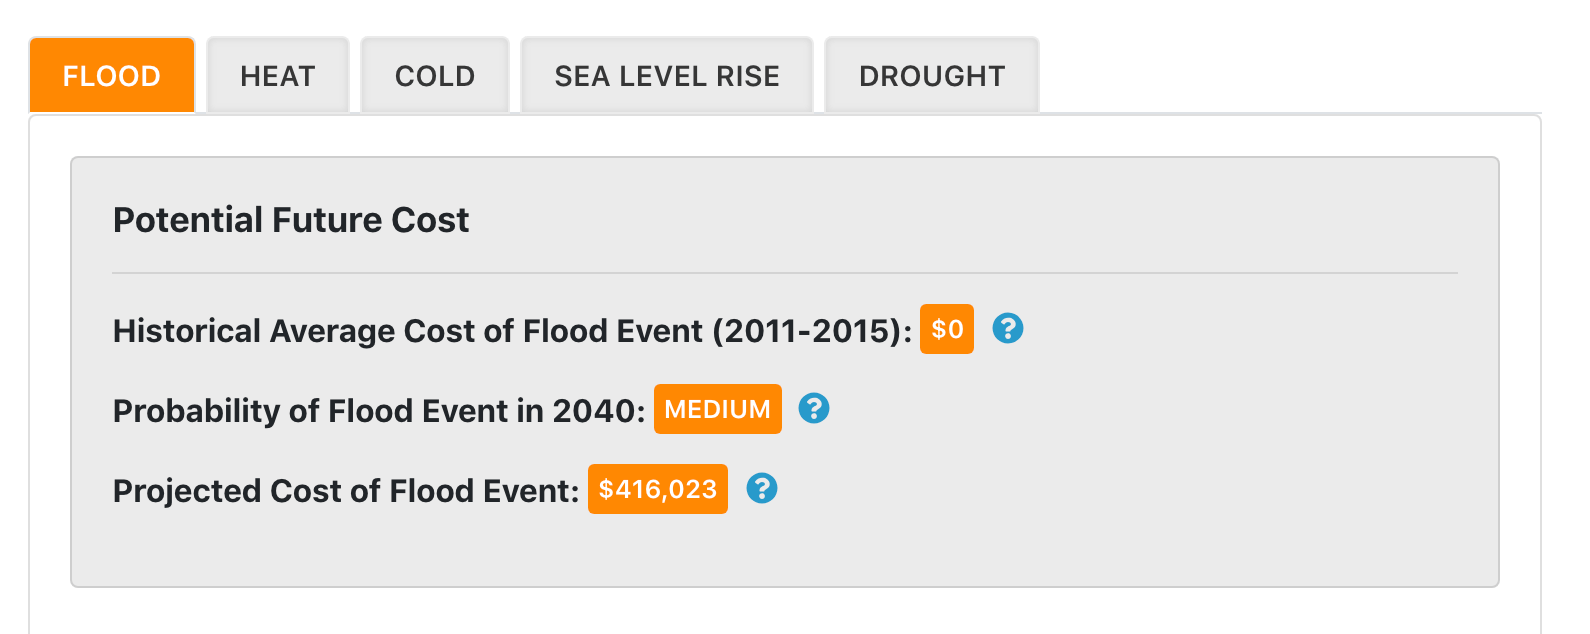
At the top of this tab is a projection of the cost of an average flood in 2040, as well as the probability of such an occurrence. Say this leader sees that their city has a high probability for flooding. On this same page, they can see scores for Risk and Readiness indicators related to flooding.
The Risk scores are the result of three main indicator categories, Exposure, Sensitivity, and Adaptive Capacity. The community leader sees that the city’s exposure (calculated from data tracking the percent of people and buildings in high risk flood zones) is high. On the other hand, the city’s sensitivity is low, and the adaptive capacity (including the ability to keep drinking water available) is high. With this knowledge, the community leader can feel confident in advocating for strategies that encourage development away from flood zones, in order to lower exposure to floods.