The ND-GAIN Country Index is an assessment, which allows users to look at how prepared a country is for global climate change, over time. This enables us to look at an incredible amount of information about the global landscape of climate change. Through this information, we are able to ask questions and look deeper into the answers. This report looks into the issue of which countries have improved their Country Index rank score the most and why.
To answer this question, we must first identify which countries have gained the most ground over the last 18 years covered in the ND-GAIN Index. This task can be accomplished by subtracting a country’s 1995 score from the country’s score in 2013. Below are the most improved countries.
|
Country |
Score Improvement |
|
United Arab Emirates |
16.06 |
|
Saudi Arabia |
13.98 |
|
Turkey |
12.56 |
|
Rwanda |
12.24 |
|
Oman |
12.04 |
|
Georgia |
11.23 |
|
Mauritius |
11.11 |
|
Angola |
10.85 |
|
Uruguay |
10.65 |
|
Belarus |
10.56 |
When one compares these numbers of improvement to the midrange scores of the ND-GAIN Scores (around 52.12), it becomes clear that these countries have substantially improved over time. This is not to say that these countries have become the best in increasing readiness or decreasing vulnerability for climate change, only to say that they have improved independently more than others. The movement of these countries through the ND-GAIN Matrix allows us to visualize this improvement:
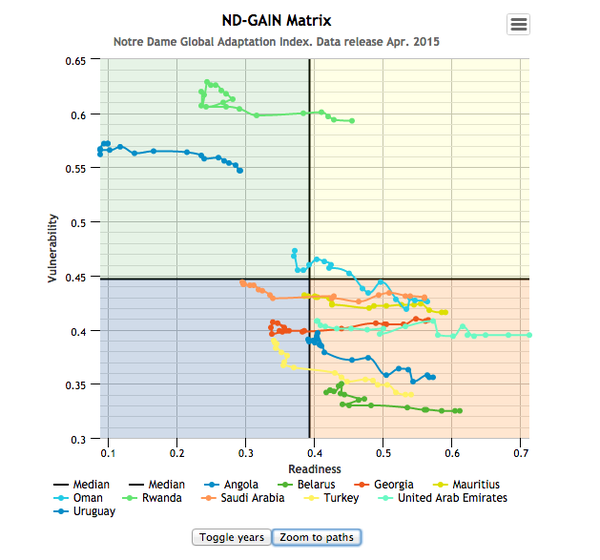
These countries are moving across the matrix into the lower right hand quadrant, which is the area associated with low vulnerability and high readiness. This visualization also allows us to notice another trend; these countries are experiencing improvements considerably more in Readiness than improvements in Vulnerability. This can be seen as the countries move much more substantially along the horizontal axis over time than over the vertical axis. This is an important distinction to make as we continue to analyze how countries attain a better score so quickly, and shows us where to look for the areas of improvement. The visualizations below from ND-GAIN also allow a closer look at how the Readiness of these countries has improve over time, in comparison to their Vulnerability.
|
Readiness Over Time |
Vulnerability Over Time |
|
|
|
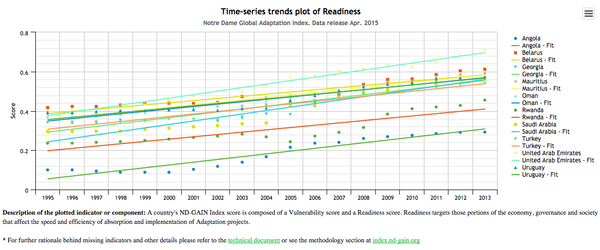
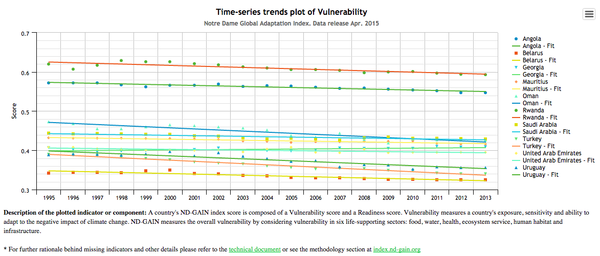
The readiness variable is increasing faster than the decreasing vulnerability score, meaning the key to these countries success on the Country Index lies in their improvements in Readiness. With this understanding, we can now move into attempting to understand what has happened within these ten countries that led to this rapid success.
These ten countries may appear to be entirely different due to differences in geographic location, government type, history, and economic systems, but all of them have improved in the ND-GAIN Index for similar reasons. These countries made major improvements in Ease of Doing Business, ICT Infrastructure, and Political Stability. These three areas are the key the improvements the countries made, and by developing them further we can understand this movement up the ND-GAIN Index Ranking.
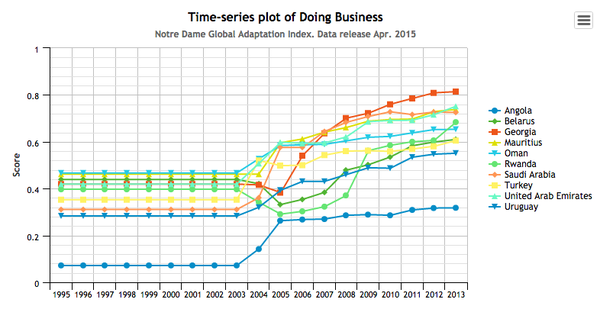
The first of these areas is Ease of Doing Business, which is a set of ten indicators developed by the World Bank Group. Unfortunately this data is not available all the way back to 1993, which explains the unchanging areas on the visualization of this indicator. Over the time in question the countries we analyzed made significant strides, with the most substantial changes coming in the Registering Property, Paying Taxes, and Trading Across Boarders indicators. These improvements to the economic system within each country allowed a general increase in the preparedness for climate change to occur. Each country has improved in its own way, some more than others. For example, Saudi Arabia and the United Arab Emirates rank among the highest in paying taxes, but have seen little improvement in enforcing contracts. Additionally, not all countries have made as much improvement as others. Angola still remains towards the bottom of the rankings, while Georgia is near the top in 2014. While these countries may have differences in the rate of improvement and the ways in which they improved, they have all improved. It’s is one of the reasons they have been able to increase their readiness for climate change so quickly. These improvements can be seen below, where Ease of Doing Business is plotted over Time for these ten countries:
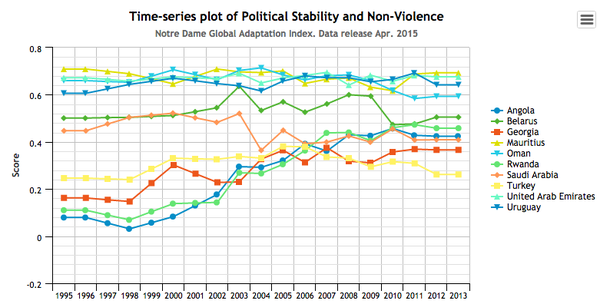
Yet another vital point to this story is the improvements these countries showed in Political Stability. This category of improvement is best described by breaking these countries into three groups: those who improved, those who worsened but then rebuilt, and those who remained mostly unchanged. Information on the history of each country was gathered here.
The first of these groups contains the countries of Rwanda, Angola, Georgia, and Turkey. Over time, each of these countries improved their political stability from where is was in 1995. The countries of Rwanda and Angola have had a violent history with civil wars and genocides on both sides. Since these events, both countries have made significant strides in peacekeeping efforts, and have improved human rights issues as well. This is dramatic improvement and clearly is key to understanding how these countries improved their climate change rankings. Georgia also made significant change around 1995 when it became independent of the Soviet Union, and has since established itself in organizations, including The United Nations. Although Georgia has had corruption issues in the past, it has also shown immense promise and progress in the political stability moving forward. Turkey has a recent history involving coups and insurgency from outside forces. These issues have caused Turkey problems, but the country has been able to maintain a slight growth in their political stability over time.
The next group of countries is those who have decreased in political stability, but made a rebound back. These countries include Saudi Arabia, Belarus, and Oman. Saudi Arabia began this time period with a political leader who suffered a stroke, leading to an odd period of leadership. Saudi Arabia also was impacted by the issues revolving around the war in Iraq and the al-Qaeda presence in the area. This led to decreased political stability, but with the ending of the war as well as oil prosperity the Saudi government has been able to retain some of its lost political stability. This kind of change helps Saudi Arabia to become more prepared for climate change. Oman also suffered from the events surrounding Iraq, but has made great progress in its elections and freedoms since. This has allowed Oman to regain what it partially lost in political stability. Belarus gained its independence at the beginning of this time period, but suffered from an authoritarian government who abused powers. This led to protests and anger, which decreased the political stability. Currently Belarus is regaining their political stability and has not seen any major political changes for a few years. These changes in political stability are not usually helpful towards climate change preparedness, but regaining stability.
The final group is those who remained mostly politically stable over this time. This includes Uruguay, Mauritius, and the United Arab Emirates. These countries experienced a great deal of change during this time period, but were able to deal with them with their current political system, which has led to their success in climate change preparedness.
The changes these countries experienced in political stability were not universal, nor were they always positive, but the massive improvements of a few has made this a notable category for why this group as a whole has increased in climate change preparedness. The historical information of these countries was gathered here. The changes in political stability can be seen graphically below.
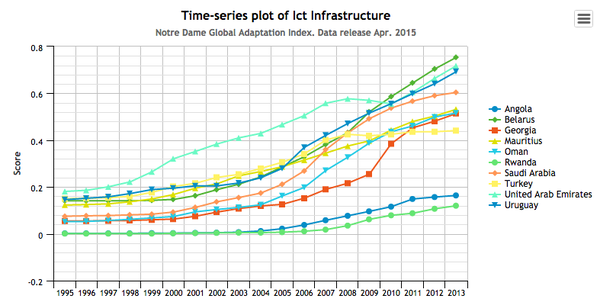
The final category for why these countries have improved so rapidly in climate change preparedness is the Information Communication Technology Infrastructure changes these countries have universally seen. The World Bankmeasures ICT Infrastructure by observing the Mobile Cellular Subscriptions per year and the Internet users per 100 people per year. In both of these categories, across 18 years in all countries, there has been improvement. These two measures show us that the ICT Infrastructure in these countries has been steadily increasing. It is undeniable that all countries have seen an improvement in ICT Infrastructure due to the boom in technology over this time. However, although all countries have improved these countries have improved significantly. This can best be seen through the examples of Oman, who improved from 3.5% internet users in 1995 to 66.5% in 2013. This kind of change compared to Oman’s next door neighbor Yemen, who only experienced a change of 22% over this same time. This kind of extreme progression was a common theme in each of these countries, and helped lead to their fast progression. Communication technology allows countries to deal with the issues surrounding climate change more effectively. It also helps to grow the economy, allowing for increased readiness for climate change. This is by far the most universal and sizable change these countries have seen, and as a result they have all experienced movement up the ND-GAIN Index Rankings. The changes in ICT Infrastructure can be seen graphically below:
In an attempt to answer the question of rapid country movement on the ND-GAIN Country Index, we have seen that there are three common threads among these ten countries, which correlate to the ND-GAIN Index Ranking. This is not to say that other factors are not at play, because they undoubtedly are. This issue is complicated, and there are most likely many more reasons to explain why this change occurred. However, these three changes are good representation as to why these countries have advanced, and can illustrate for us a few important improvements to better understand this issue.
Through exploring this question, we have been able to find the top ten movers in the ND-GAIN Country Index, and we have learned that the key to their movement is Readiness to accept adaptation investment. This question has shown a great deal about these ten countries, and has allowed us to see how they changed over the past 18 years. This information shows how we can use tools to paint a picture of how the global landscape of climate change preparedness is changing. In a world where climate change is upon us, questions like this allow us to gain an understanding of the situation past and present so that we can better adjust for the future.